


hover over top right corner of images and click on plus sign to expand
photo: Leonid Furmansky
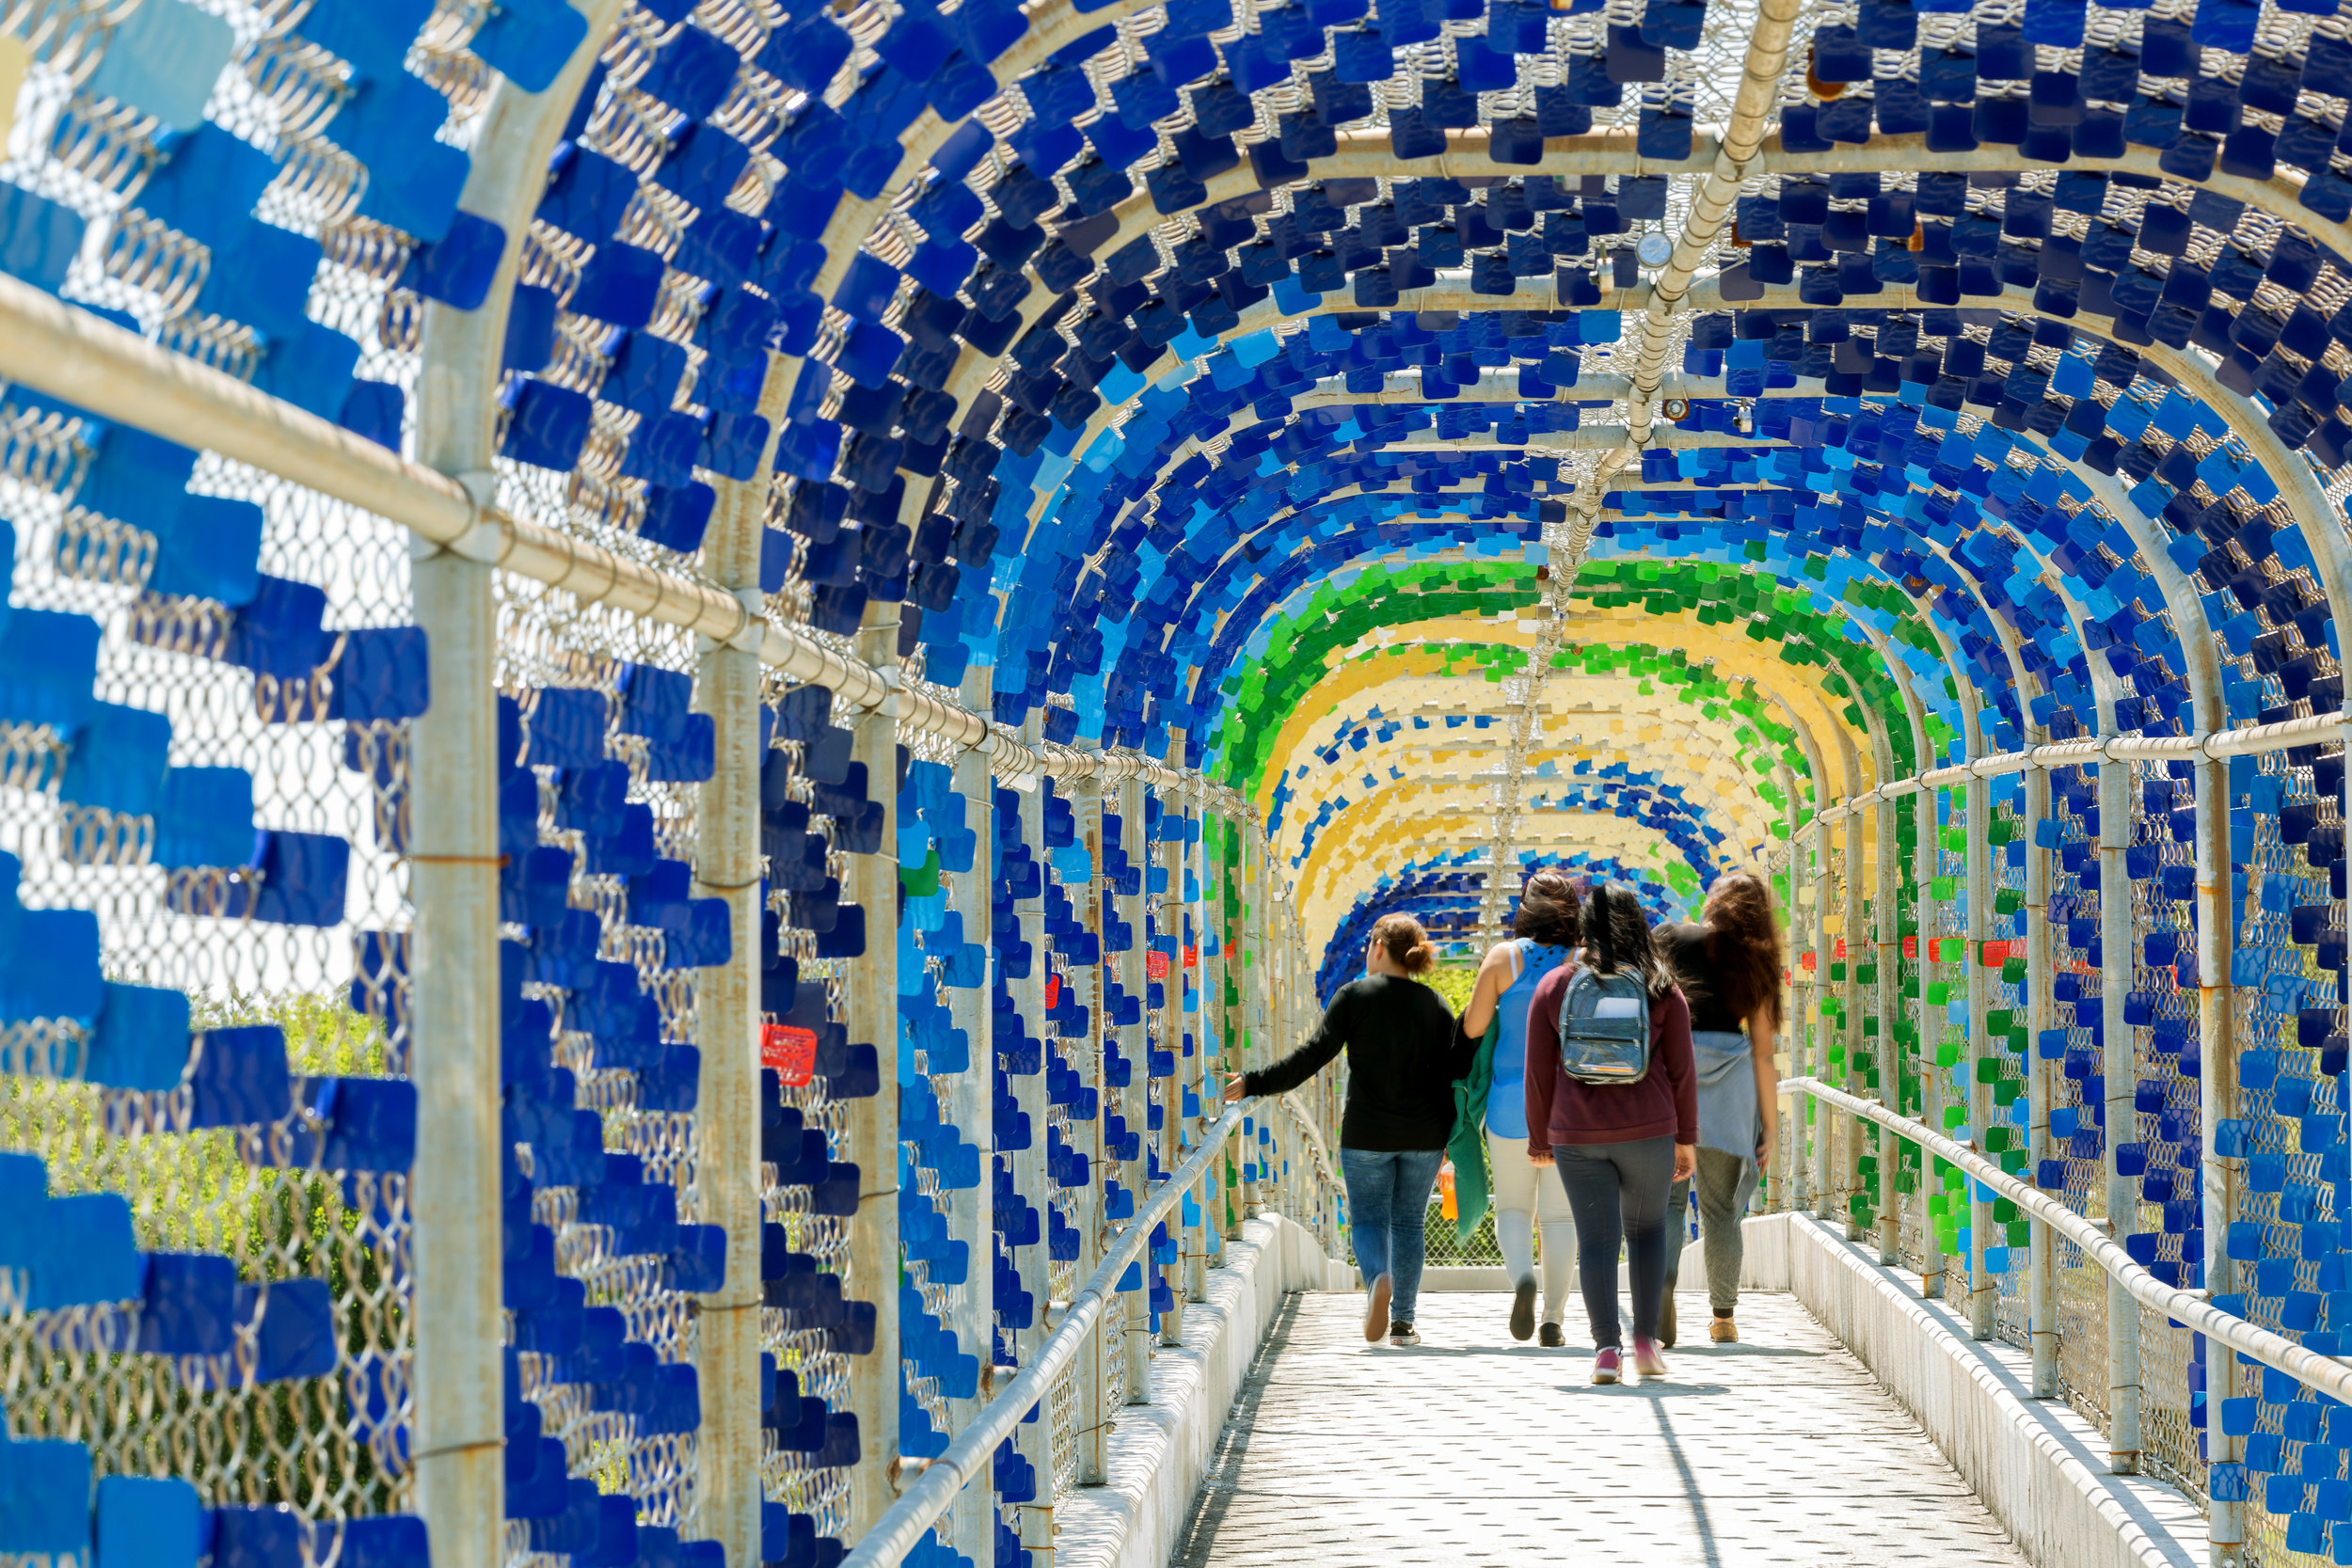
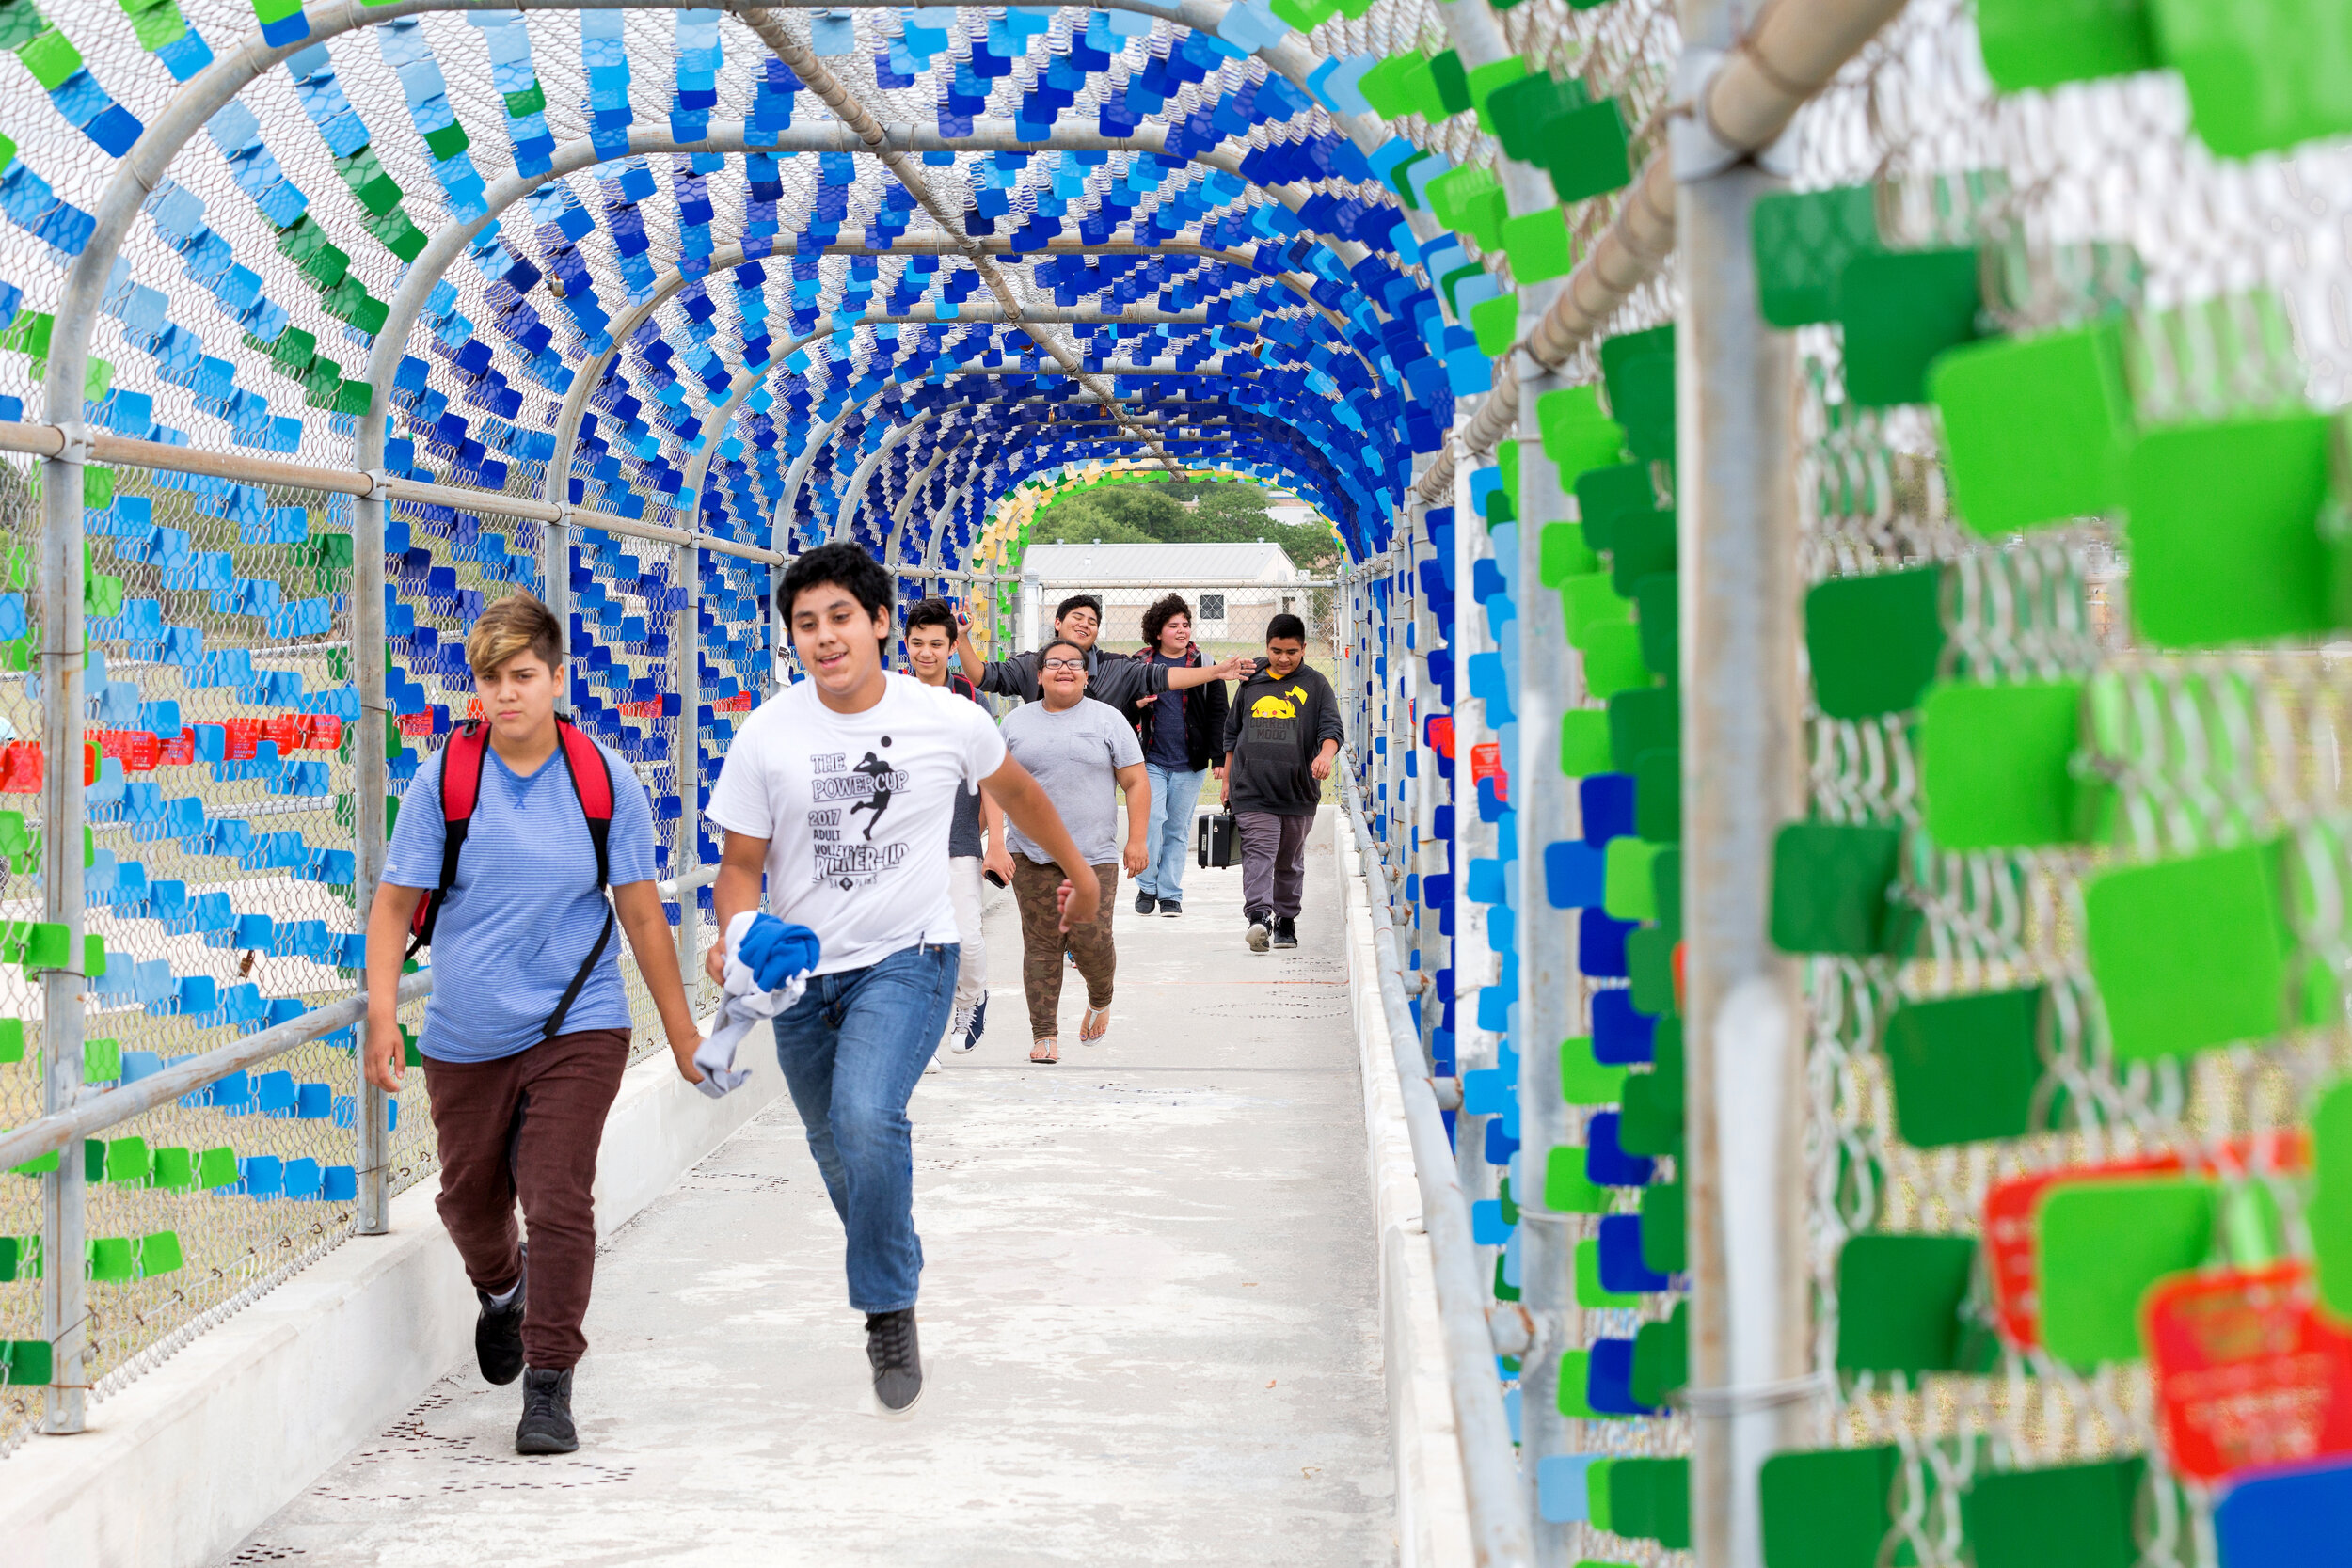
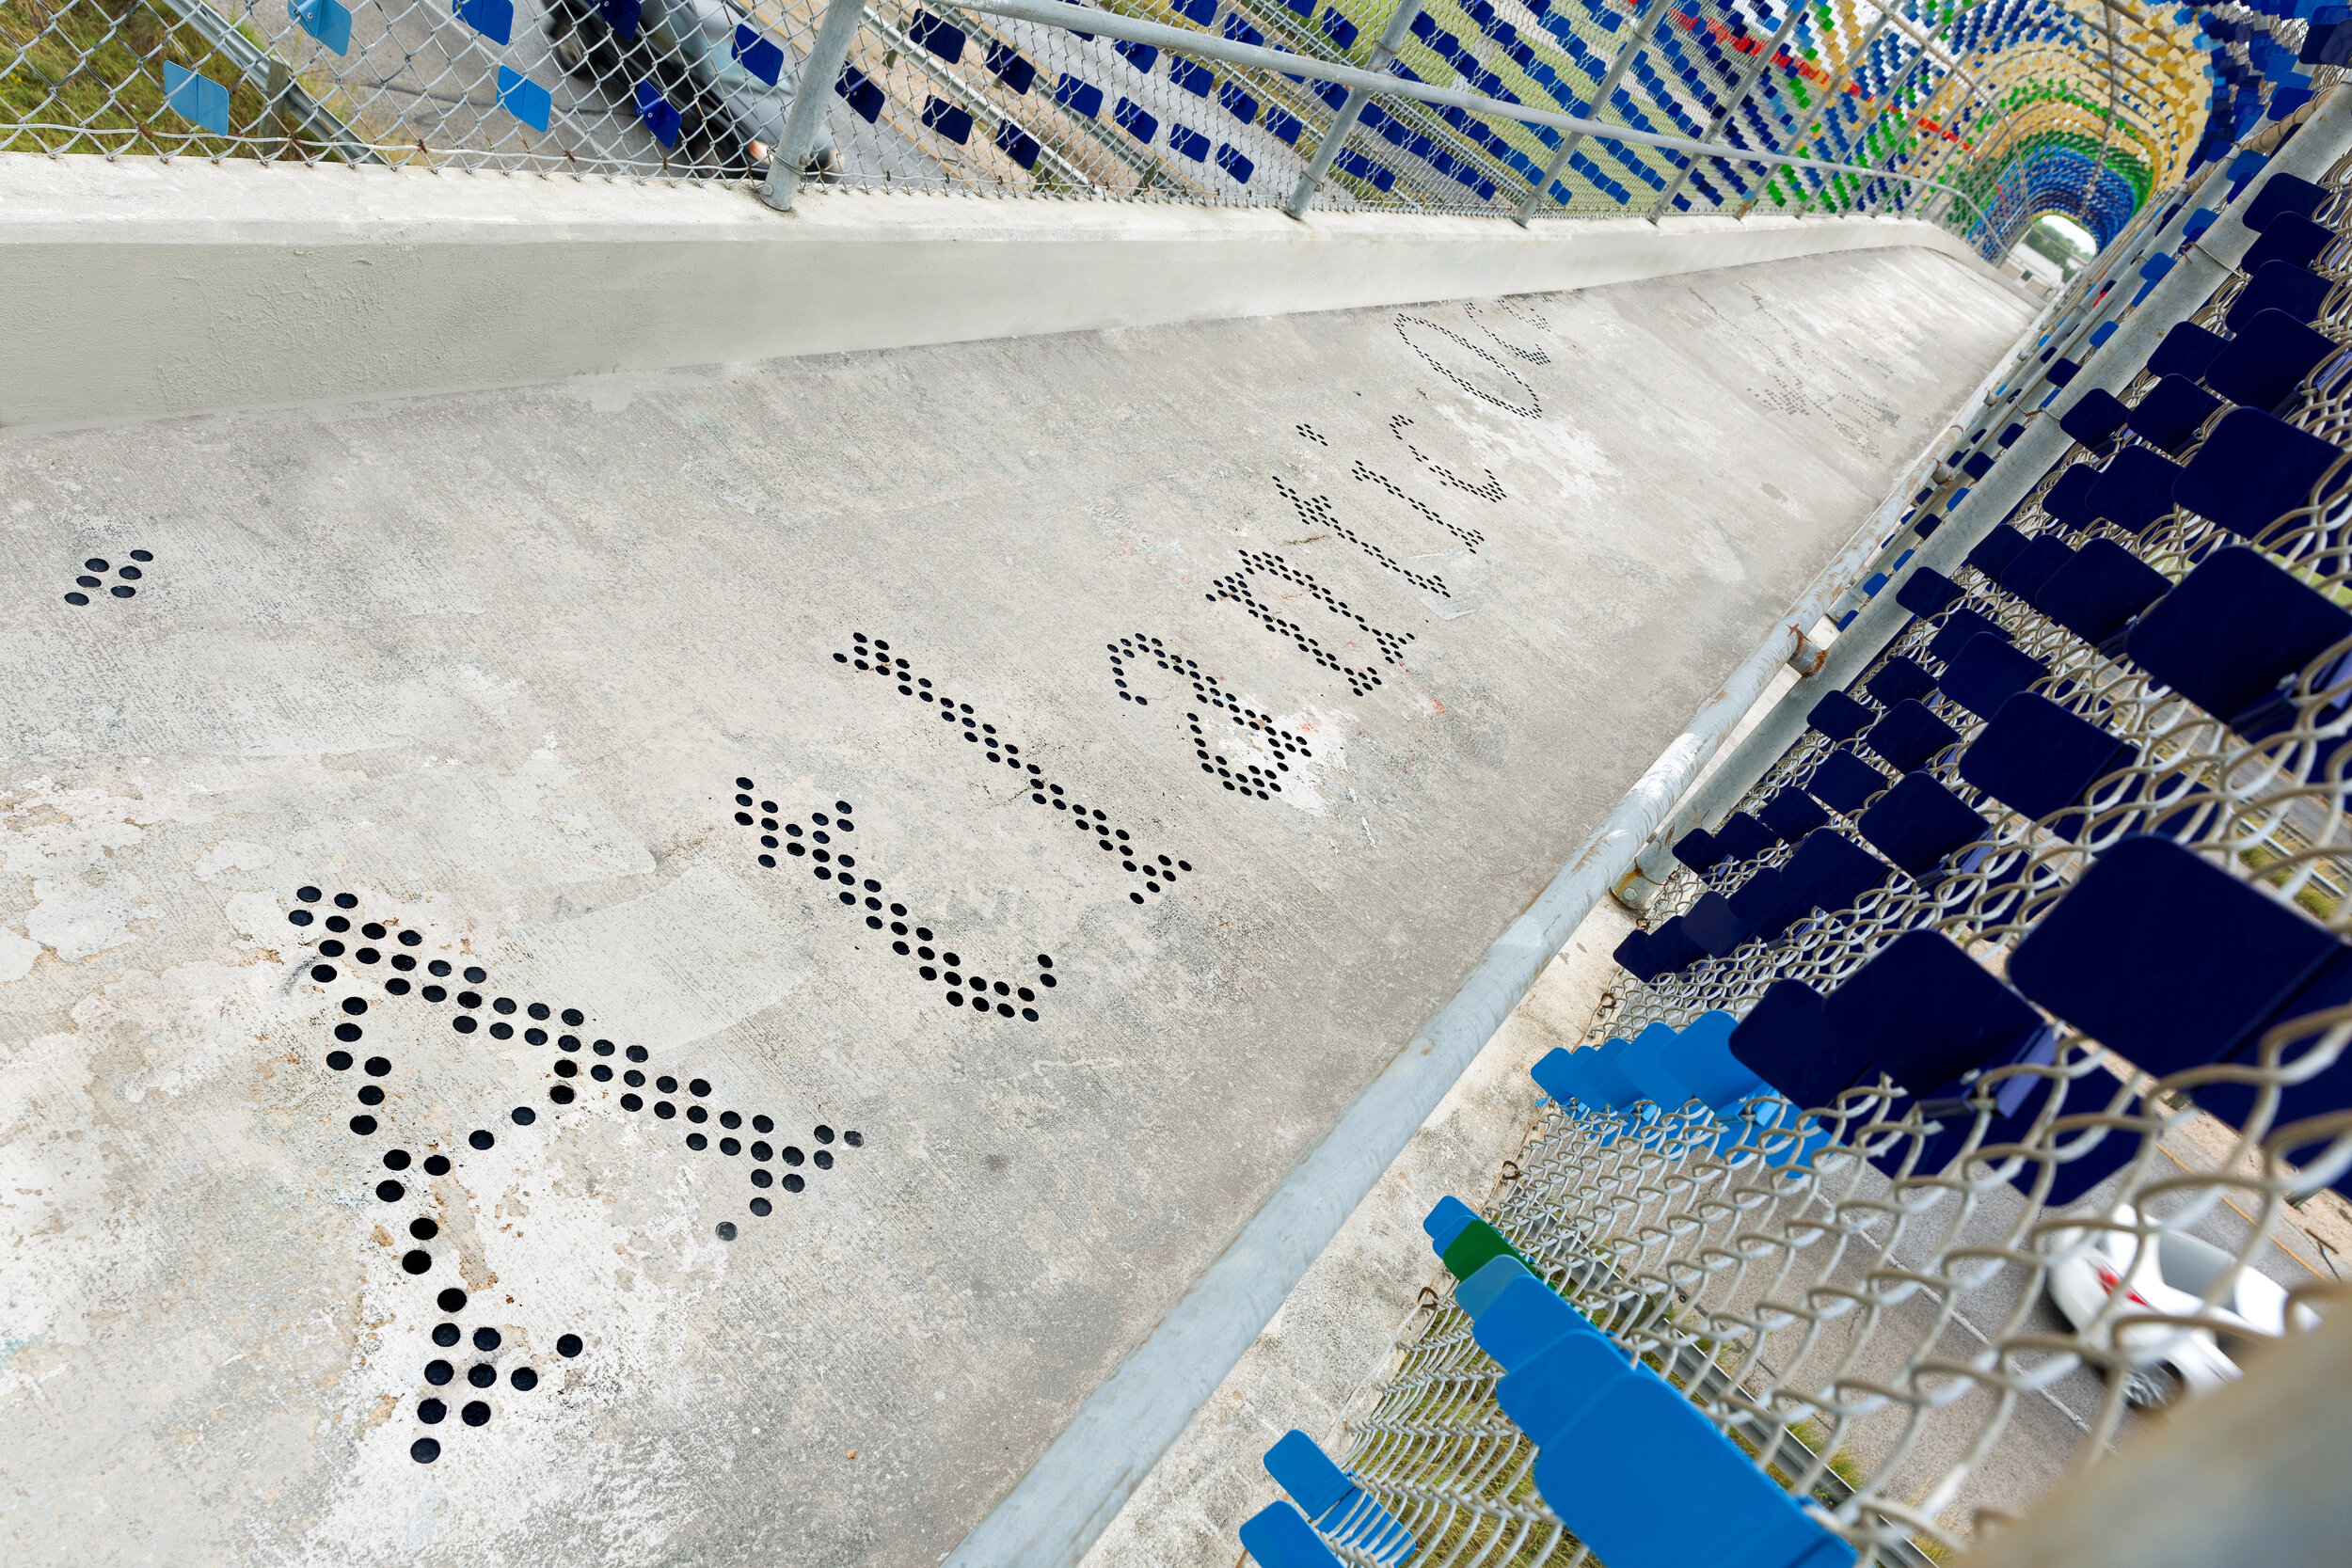
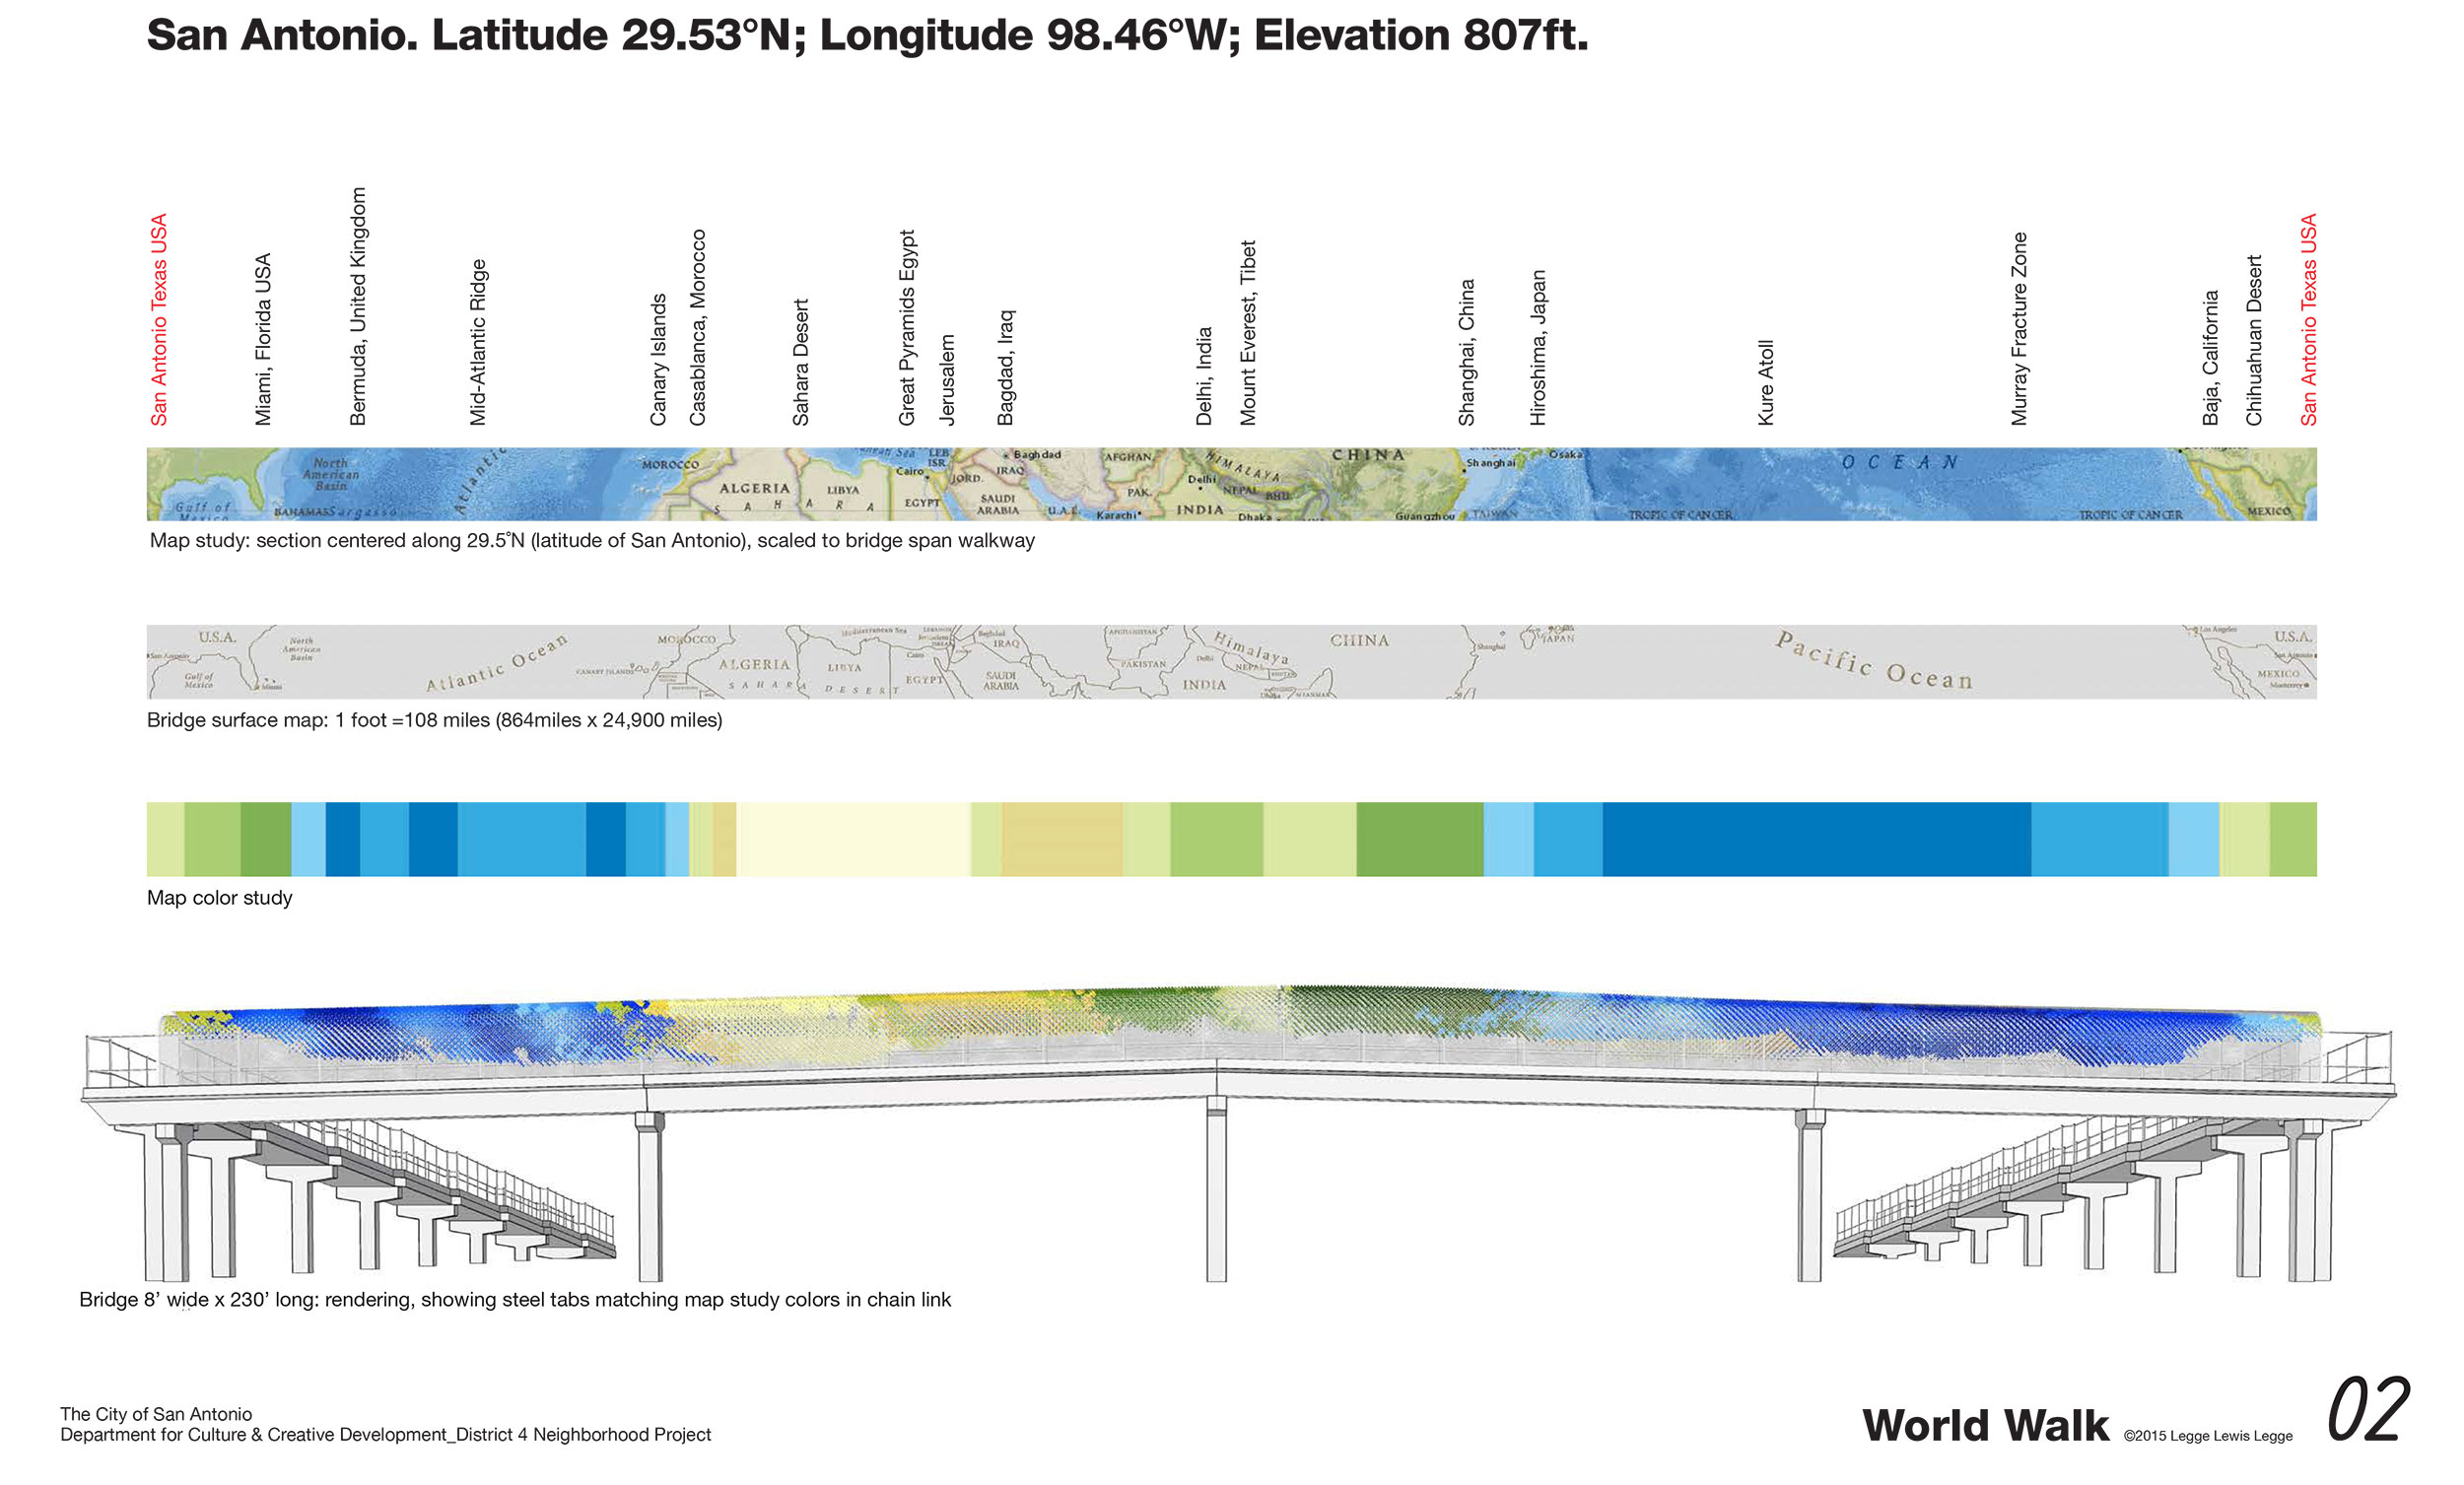
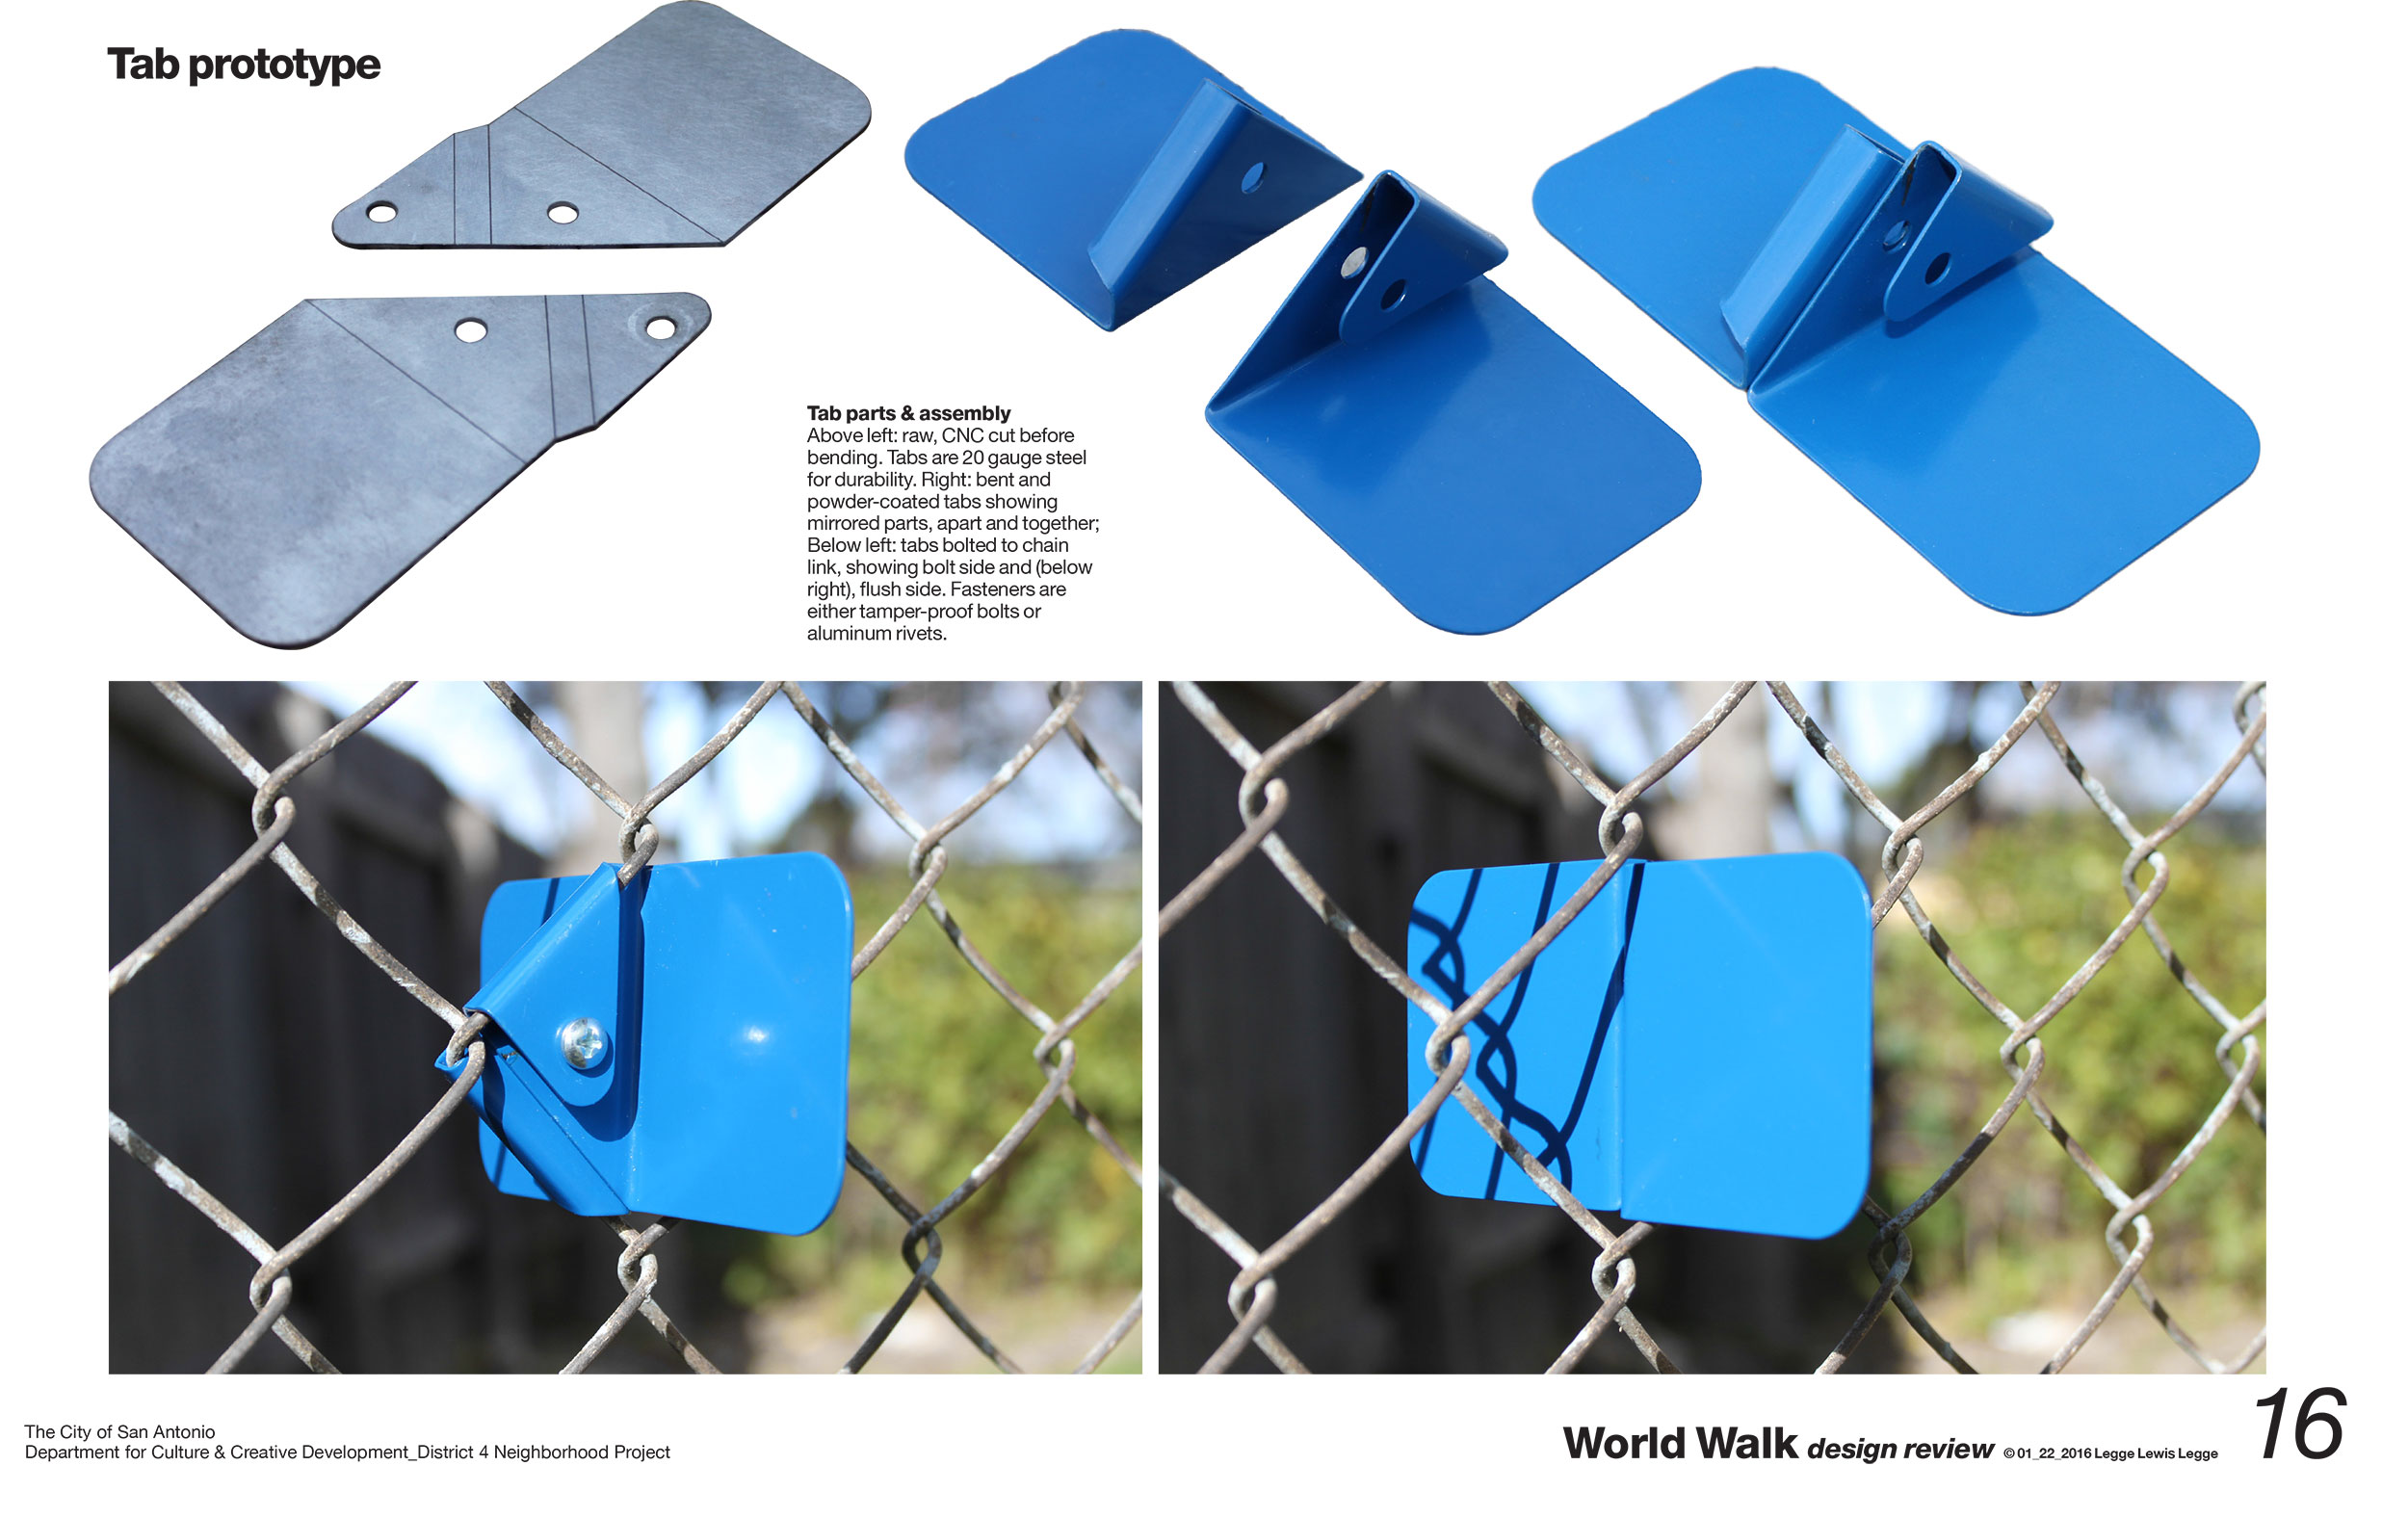
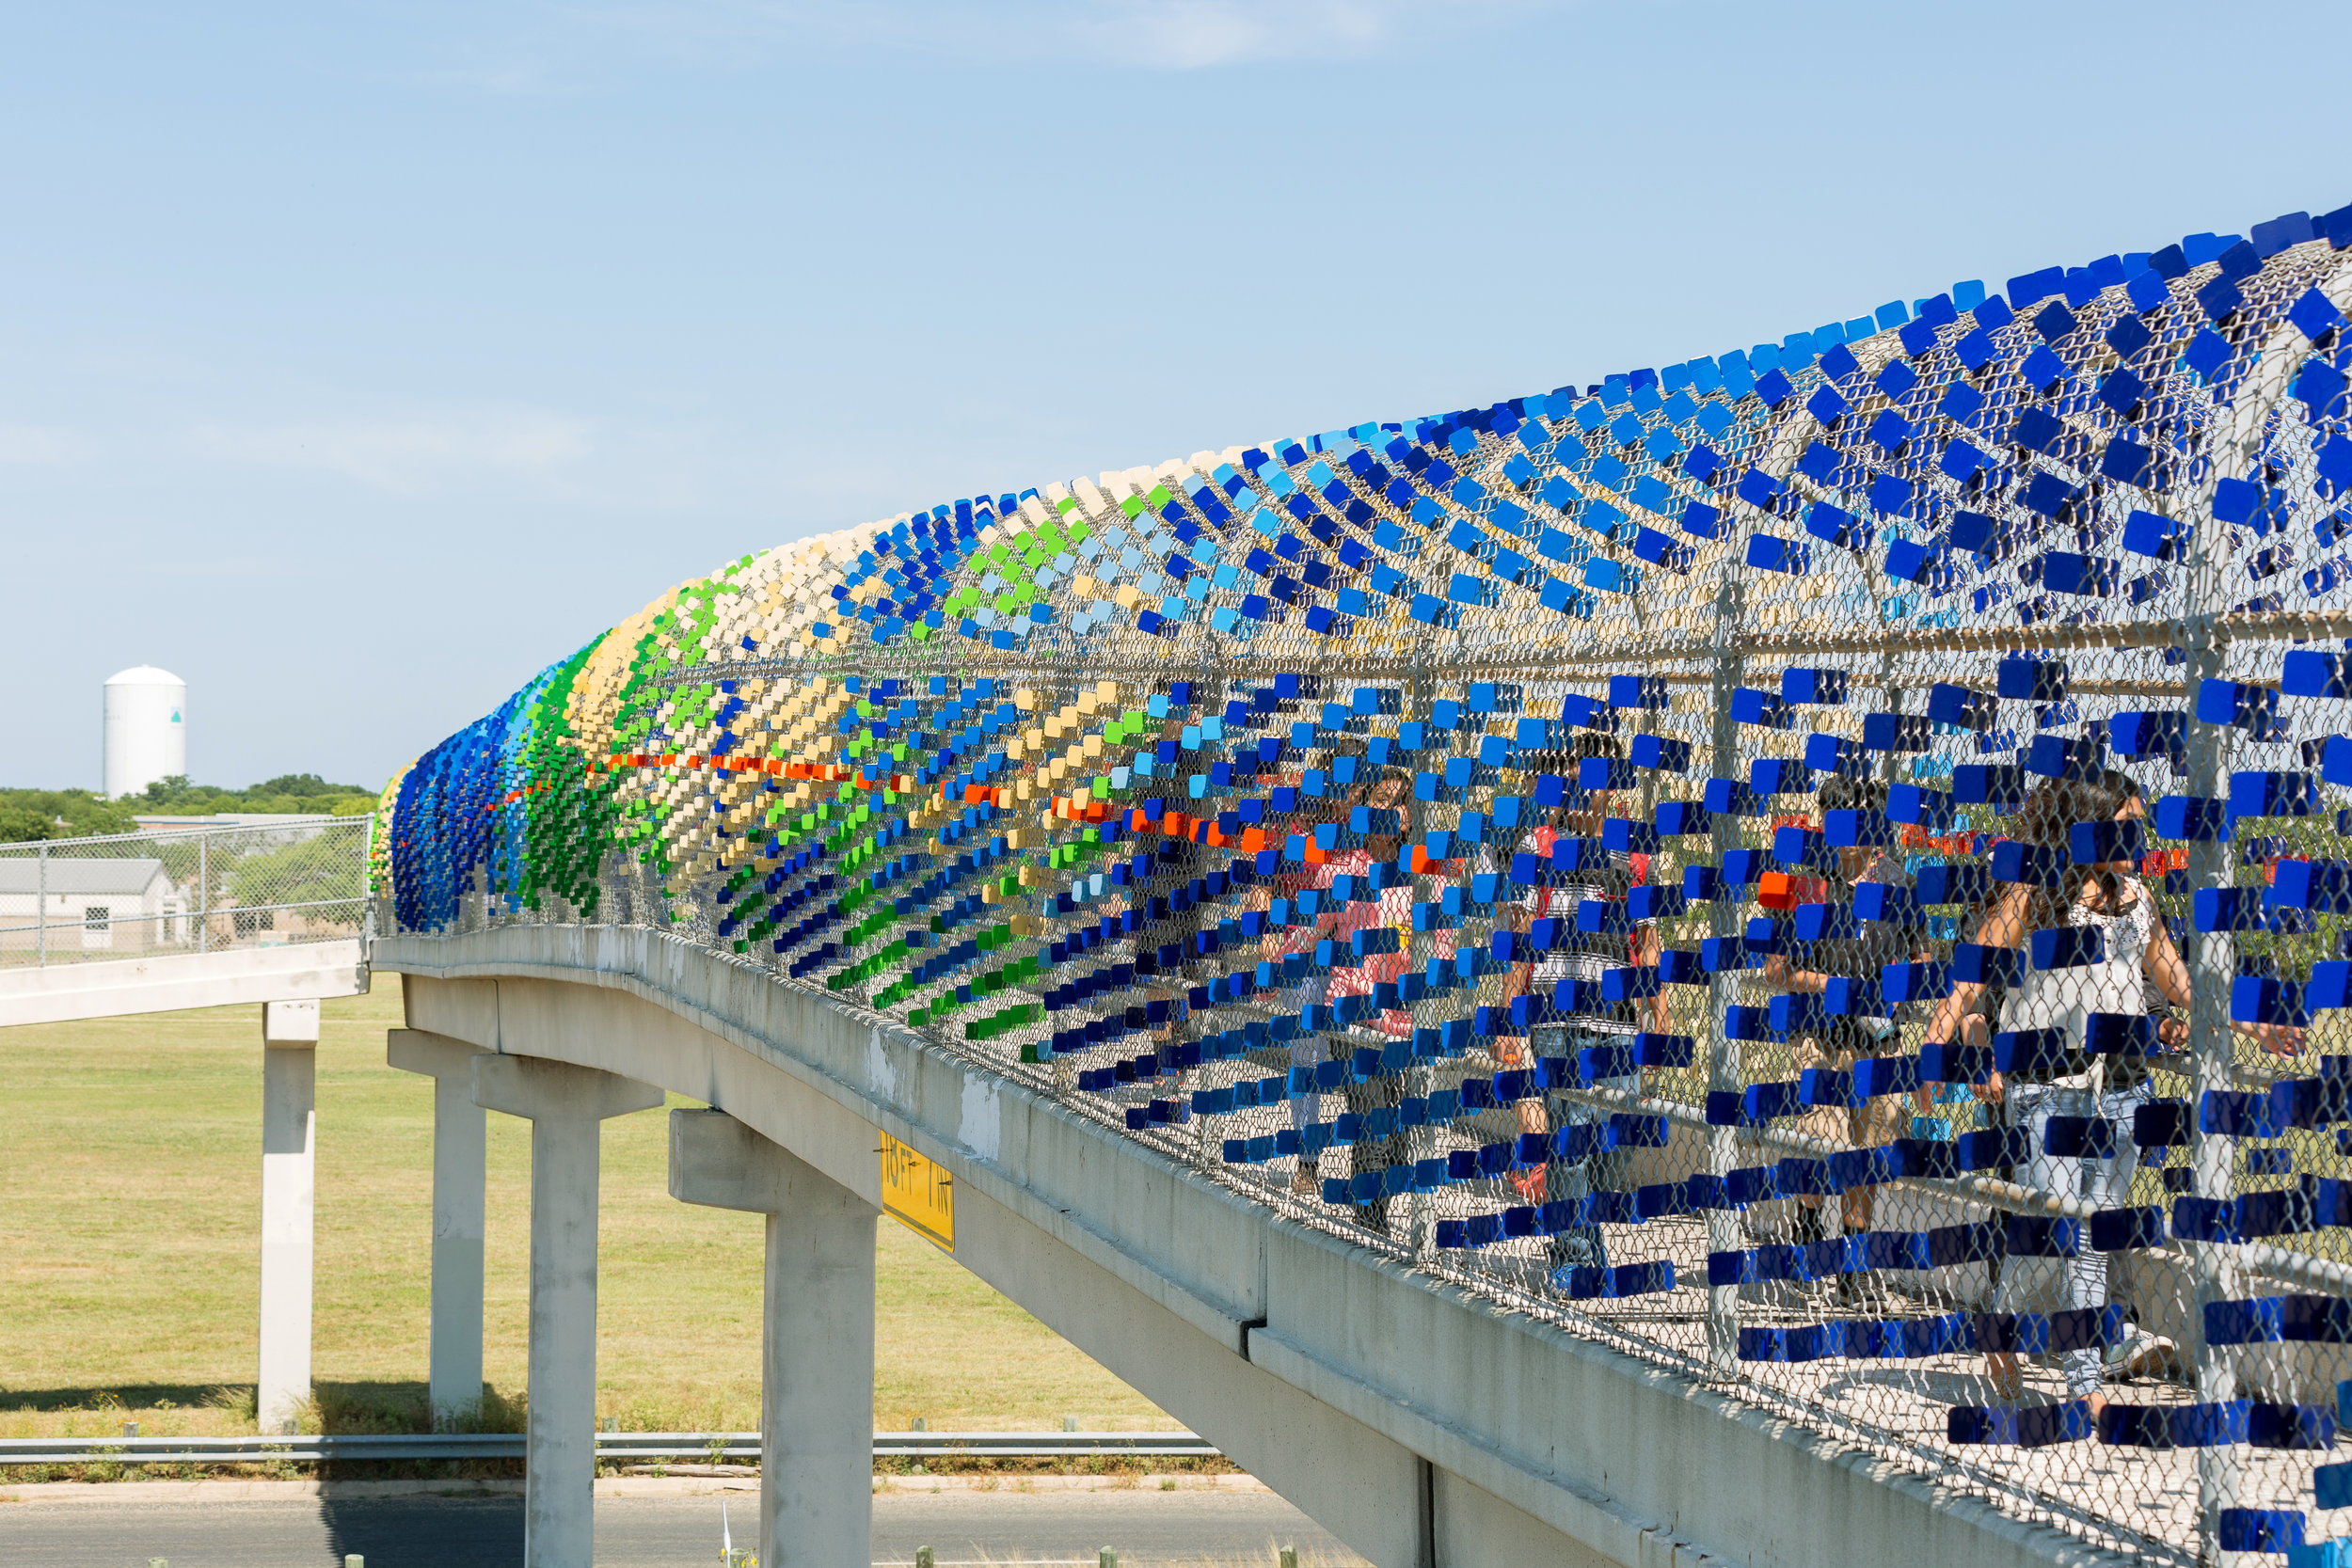
‘World Walk’ turns a pedestrian bridge into an immersive atlas centered at San Antonio, Texas and becomes a walk around the world, covering 24,900 miles of vast and disparate regions of the globe as a map permanently etched across the entire concrete bridge span. Colored steel tabs permanently affixed to the existing chain link beautify and highlight corresponding climactic zones, while special steel tabs developed in collaboration with local area public school students are etched with a myriad of corresponding geographical subjects and information.
Year Completed: 2017 permanent
Medium: concrete dimple-etched map, steel tabs
Dimensions: 240’ x 6' x 8’
Site: San Antonio TX
Client(s): City of San Antonio Dept. of Culture and Creative Development
Budget: $90,000.00
photo: Leonid Furmansky
photo: Leonid Furmansky
photo: Leonid Furmansky
photo: Leonid Furmansky
photo: Leonid Furmansky
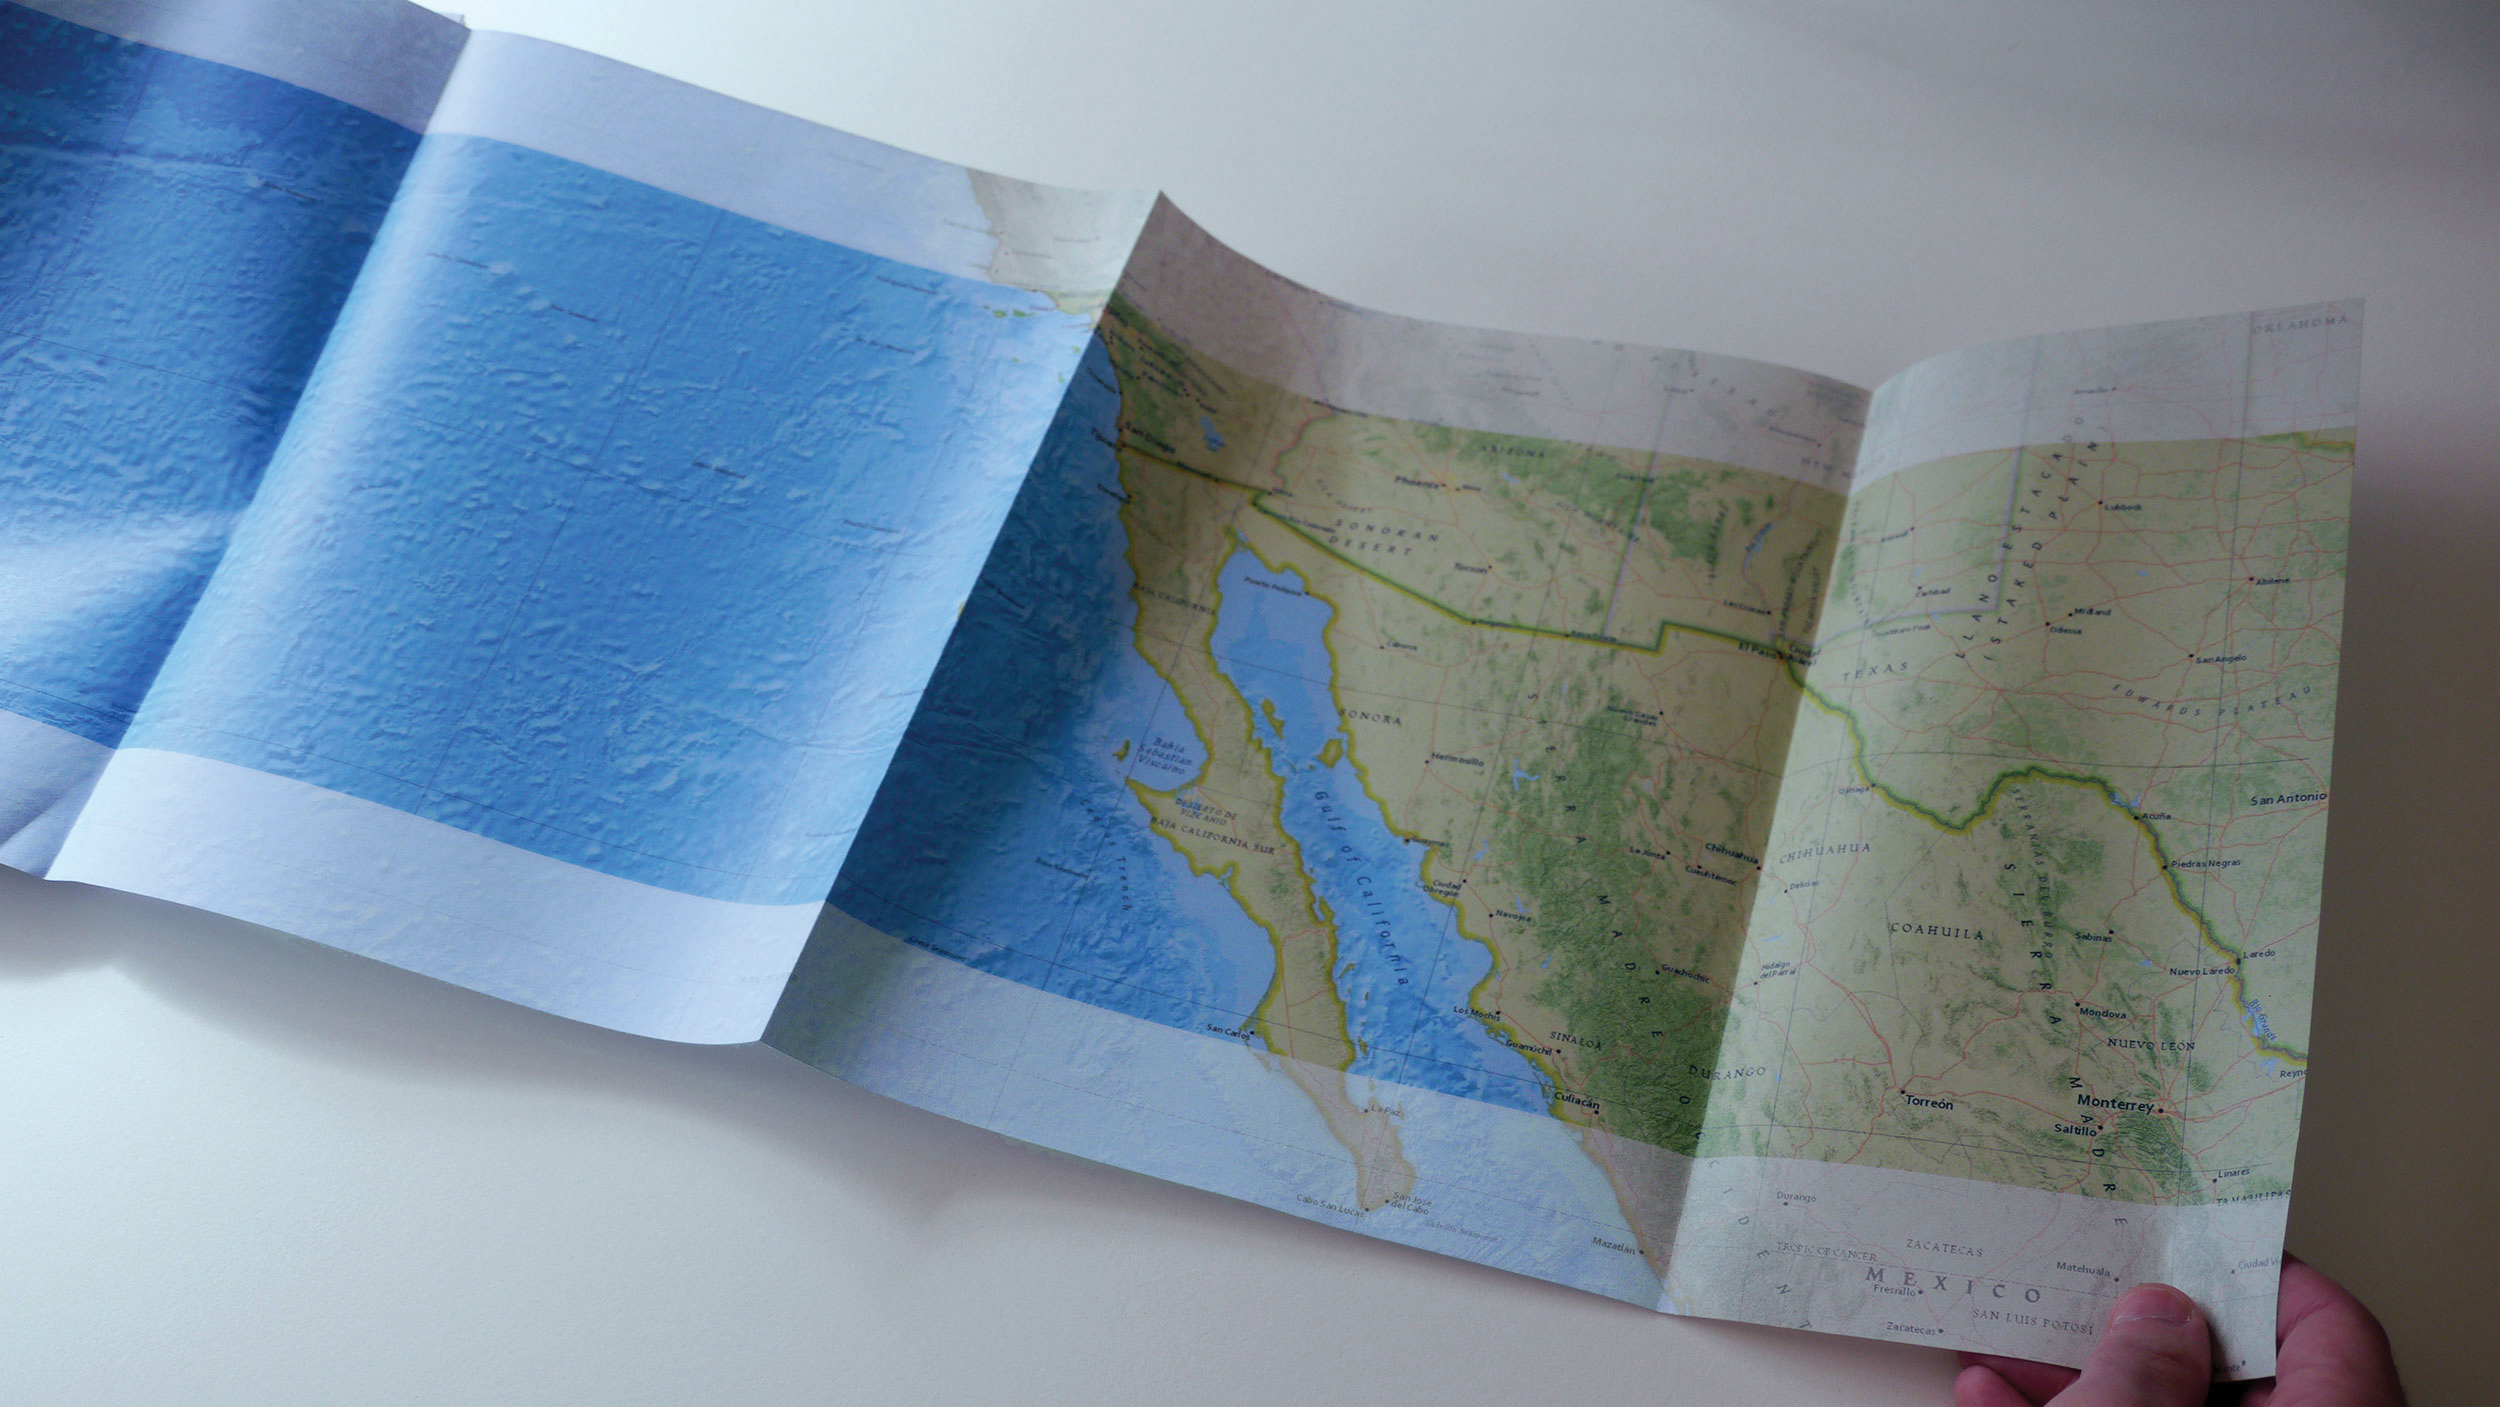
Climactic region data across the map, which was used to color the steel tabs
photo: Leonid Furmansky
photo: Leonid Furmansky
photo: Leonid Furmansky